KPI Dashboard

The MERN stack is a powerful combination of technologies, consisting of MongoDB, Express.js, React.js, and Node.js. This application leverages these technologies to provide an intuitive and efficient user experience.
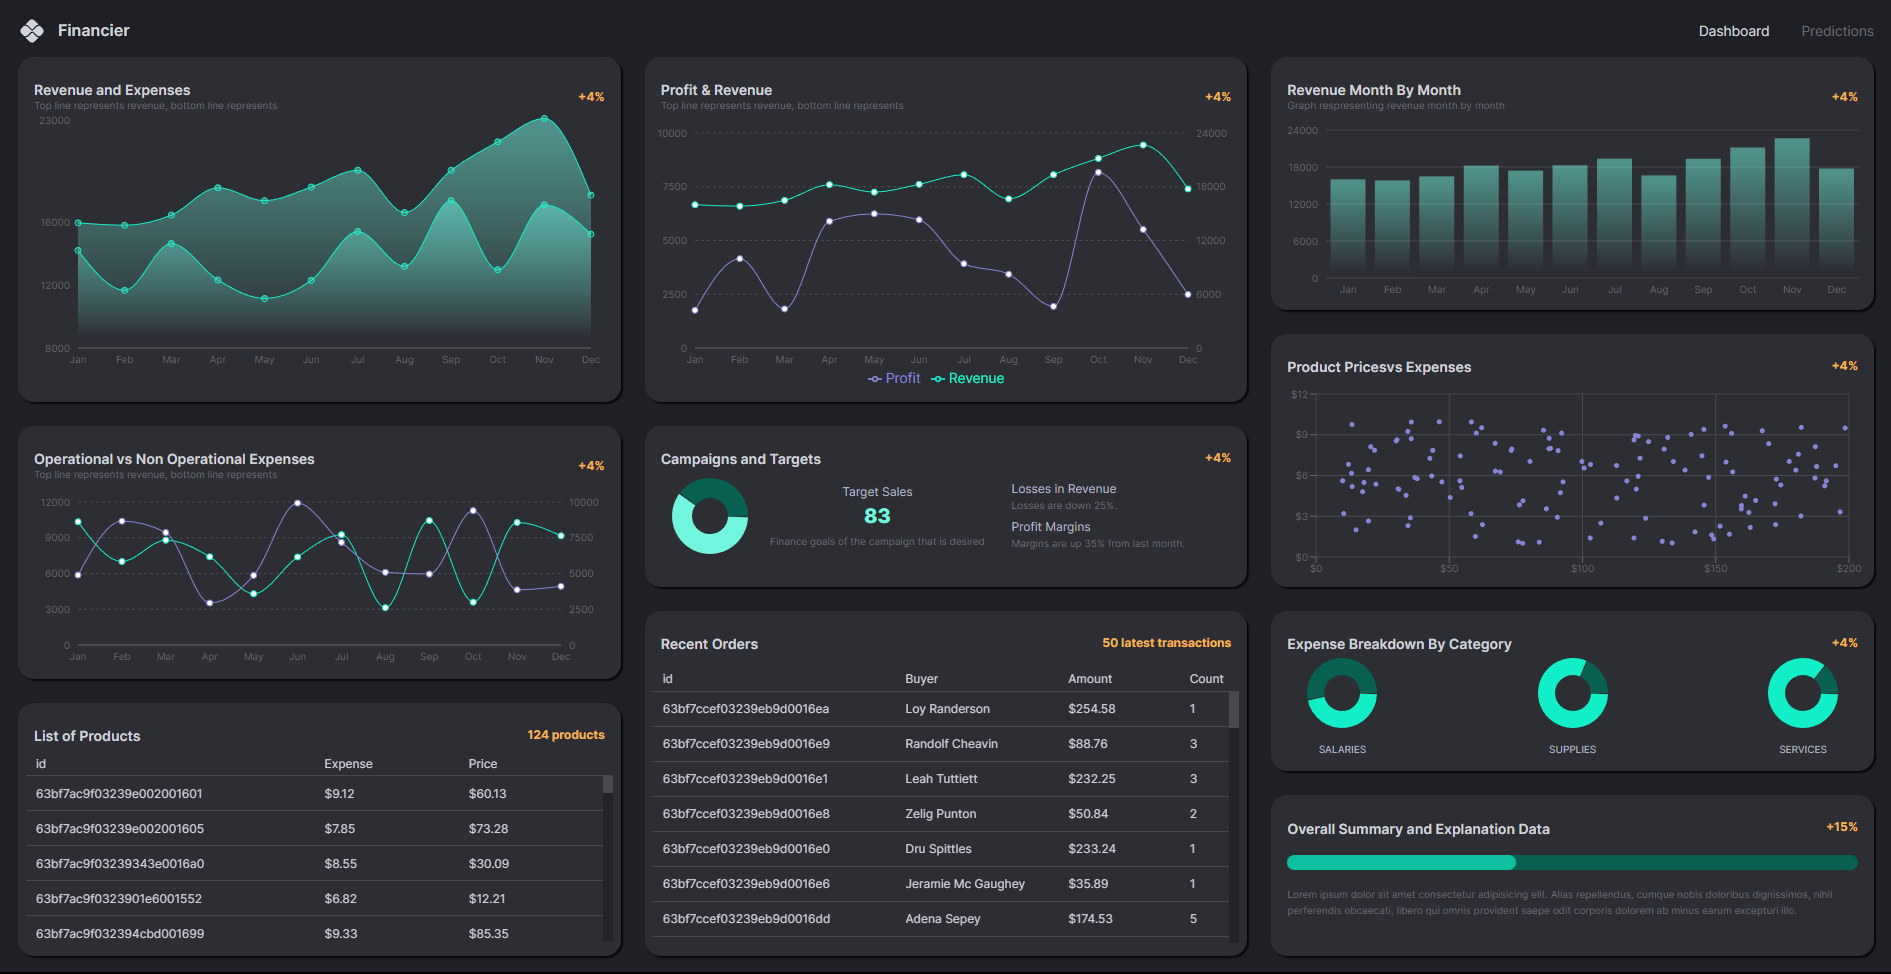
The dashboard is designed to present key performance indicators (KPIs) in the form of beautiful charts. These charts are visually engaging and allow users to quickly grasp important insights from the data. The charts are generated using popular data visualization libraries such as Chart.js or D3.js, ensuring high-quality and interactive visualizations.
The data for the dashboard is stored in MongoDB, a NoSQL database known for its flexibility and scalability. MongoDB allows for efficient retrieval and manipulation of data, enabling real-time updates to the dashboard as new data is added.
Here's the project: MERN Dashboard App
GitHub code: Code repository
Key takeaways
- Improved error handling with Typescript
- Learned to integrate a machine learning algorithm, linear regression, to make predictions
- Managing state with React Redux Toolkit
- Deploying using Netlify and Render